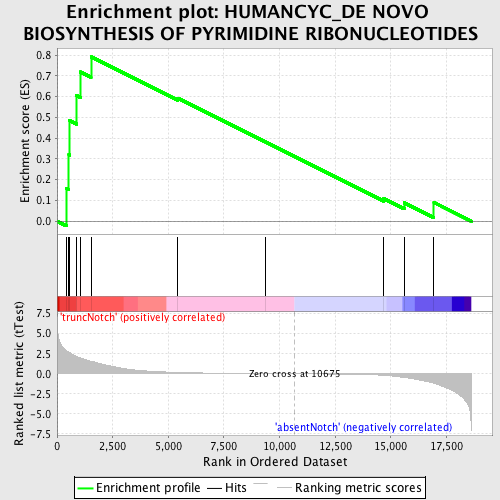
Profile of the Running ES Score & Positions of GeneSet Members on the Rank Ordered List
| Dataset | Set_03_absentNotch_versus_truncNotch.phenotype_absentNotch_versus_truncNotch.cls #truncNotch_versus_absentNotch |
| Phenotype | phenotype_absentNotch_versus_truncNotch.cls#truncNotch_versus_absentNotch |
| Upregulated in class | truncNotch |
| GeneSet | HUMANCYC_DE NOVO BIOSYNTHESIS OF PYRIMIDINE RIBONUCLEOTIDES |
| Enrichment Score (ES) | 0.7919087 |
| Normalized Enrichment Score (NES) | 1.4346884 |
| Nominal p-value | 0.036764707 |
| FDR q-value | 0.6557888 |
| FWER p-Value | 1.0 |
| PROBE | DESCRIPTION (from dataset) | GENE SYMBOL | GENE_TITLE | RANK IN GENE LIST | RANK METRIC SCORE | RUNNING ES | CORE ENRICHMENT | |
|---|---|---|---|---|---|---|---|---|
| 1 | CTPS | 70451 1740132 | 429 | 2.854 | 0.1571 | Yes | ||
| 2 | NME6 | 510136 6380722 | 530 | 2.660 | 0.3195 | Yes | ||
| 3 | CAD | 2340717 | 555 | 2.636 | 0.4846 | Yes | ||
| 4 | UMPS | 2340541 4730438 | 873 | 2.175 | 0.6048 | Yes | ||
| 5 | DHODH | 3170072 | 1051 | 1.964 | 0.7192 | Yes | ||
| 6 | NME3 | 1660440 | 1525 | 1.554 | 0.7919 | Yes | ||
| 7 | NME2 | 2190672 | 5412 | 0.166 | 0.5935 | No | ||
| 8 | CTPS2 | 360647 3940110 | 9353 | 0.022 | 0.3832 | No | ||
| 9 | NME7 | 60170 1230551 2850333 4200102 4560411 5090647 | 14684 | -0.191 | 0.1087 | No | ||
| 10 | NME4 | 3140736 5900446 | 15607 | -0.460 | 0.0882 | No | ||
| 11 | NME1 | 770014 | 16938 | -1.164 | 0.0902 | No |

